Someone thought I should post these and maybe they will help you:
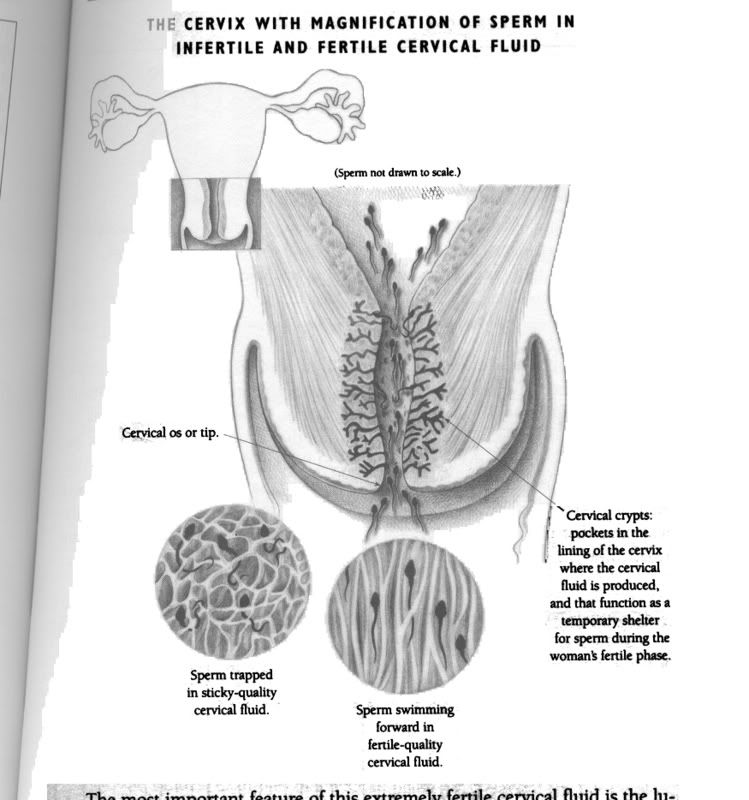
This chart shows the "Pool" that the sperm sit in waiting for the egg while being exposed to pH (pool is called the cervical crypts)
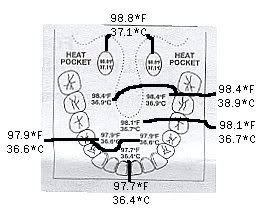
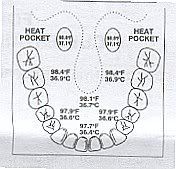
This chart show why temping with the mouth (oral temping) isn't as accurate as vaginal temping:
Cervical mucus stages:


Here is another chart. It show the endometrial glands inside the uterus. These glands secret a fluid similar to cervical mucus that will have the same pH of the cm. These glands go all the way up till you reach the fimbria (Fingers in the Fallopian tubes that make the egg move)
Great website that explains this:
http://www.gardenoffertility.com/reprofemale.shtml
And here is another diagram:

What ovulation actually looks like (ovulation is not instant; it does not burst out and can take hours):
![]()

I drew this diagram to explain timing. This is the simple version. If you want to read the science here is that link http://humrep.oxfordjournals.org/cgi/reprint/11/1/2
![]()
![]()
This chart shows the "Pool" that the sperm sit in waiting for the egg while being exposed to pH (pool is called the cervical crypts)
This chart show why temping with the mouth (oral temping) isn't as accurate as vaginal temping:
Cervical mucus stages:
Here is another chart. It show the endometrial glands inside the uterus. These glands secret a fluid similar to cervical mucus that will have the same pH of the cm. These glands go all the way up till you reach the fimbria (Fingers in the Fallopian tubes that make the egg move)
Great website that explains this:
http://www.gardenoffertility.com/reprofemale.shtml
And here is another diagram:
What ovulation actually looks like (ovulation is not instant; it does not burst out and can take hours):

I drew this diagram to explain timing. This is the simple version. If you want to read the science here is that link http://humrep.oxfordjournals.org/cgi/reprint/11/1/2
